

arviz_plots.PlotCollection.facet_map#
- PlotCollection.facet_map(func, func_label=None, *, var_names=None, filter_vars=None, coords=None, **kwargs)[source]#
Apply a visual function to plots filtered by variable names and coordinates.
This is a convenience wrapper around
mapthat uses the samevar_namesandcoordsinterface as plotting functions likeplot_dist.- Parameters:
- func
strorcallable Visual function to apply. If a string, it’s looked up in the visuals module (e.g., “set_xlim” becomes
arviz_plots.visuals.set_xlim).- func_label
str, optional Variable name with which to store the object returned by func. Defaults to
fun.__name__.- var_names
strorlistofstr, optional Variables to apply the function to. If not provided, applies to all variables.
- filter_vars{
None, “like”, “regex”}, defaultNone - coordsmapping, optional
Coordinates to filter which plots get updated. Only plots with matching coordinate values will be affected.
- **kwargs
Passed to
map.
- func
- Returns:
PlotCollectionReturns self to allow method chaining.
See also
arviz_plots.PlotCollection.mapapply a function as many times as needed given faceting and aesthetic mappings
Notes
When calling
mapit sets ignore_aes as “all” if not present, and if a “labeller” key is present in kwargs but hasNoneas value, the value is updated to eitherBaseLabellerorNoVarLabeller(if the variable isn’t used for facetting)Examples
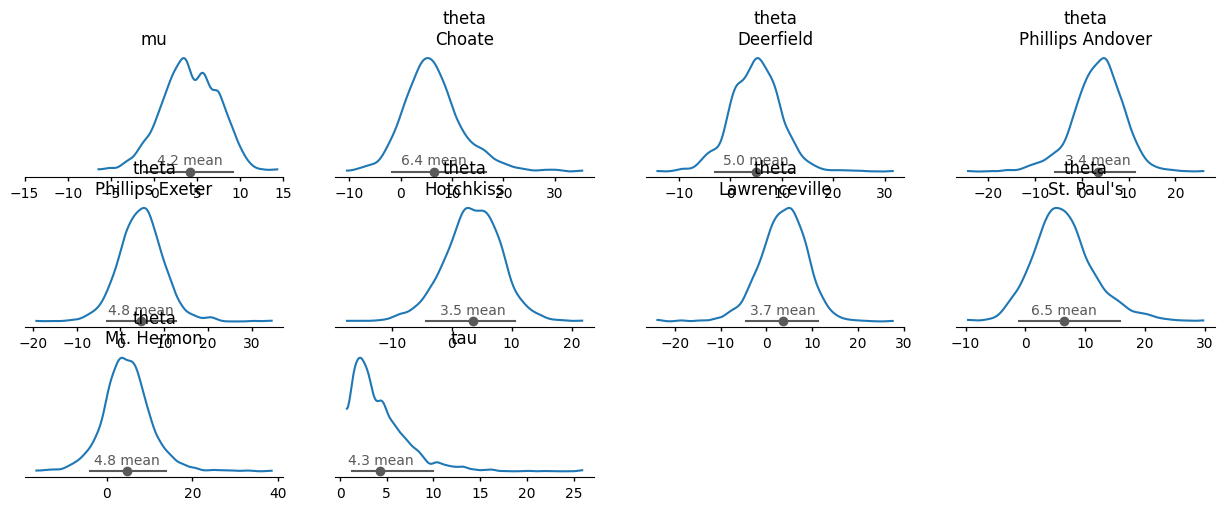
Set x-axis limits on a specific variable:
import arviz_base as azb
import arviz_plots as azp
data = azb.load_arviz_data("centered_eight")
pc = azp.plot_dist(data)
pc.facet_map("set_xlim", limits=(-15, 15), var_names="mu")
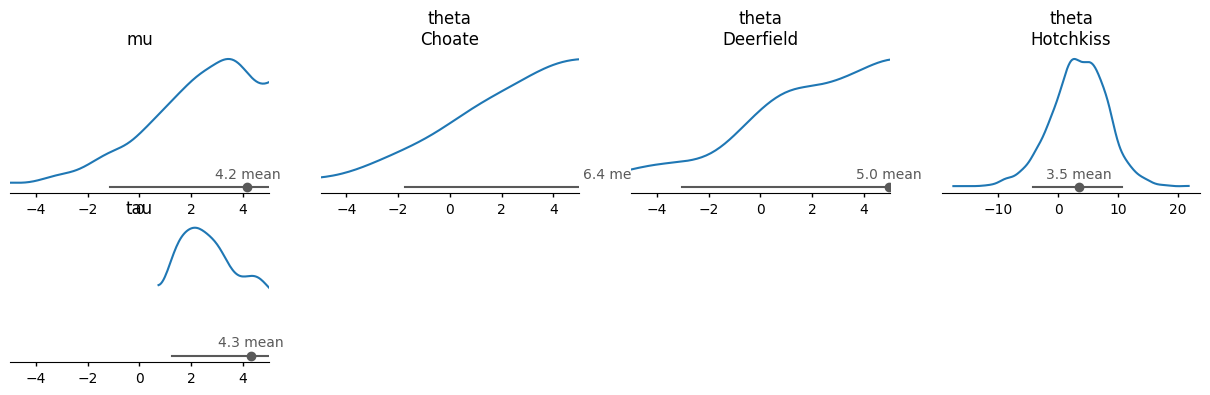
Apply with coordinate filtering:
pc = azp.plot_dist(data, coords={"school": ["Choate", "Deerfield", "Hotchkiss"]})
pc.facet_map(
    "set_xlim",
    limits=(-5, 5),
    coords={"school": ["Choate", "Deerfield"]}
)
Note that the same way that
plot_distwith no variable names specified plots all of them, applying the filtering only to the relevant ones,facet_mapbehaves the same when coords are given but no variable names.